


When metrics go red and logs tell half a story, tracing completes the picture
From guesswork to precision, distributed tracing gives us tools for debugging in complex environments.

👋 Hi, I’m Thomas. Welcome to a new edition of Beyond Runtime, where I dive into the messy, fascinating world of distributed systems, debugging, AI, and system design. All through the lens of a CTO with 20+ years in the backend trenches.
QUOTE OF THE WEEK:
“Observability is not something that can be added to applications and systems like tinsel on a Christmas tree. Real Observability must be the source of the applications and systems, the cone from which the tree must start.” - Robert M. Pirsig, Zen and The Art of Motorcycle Maintenance
Imagine trying to debug a user-reported slowdown in your platform. The logs look fine. Metrics show a latency spike. But you’re stuck. Unsure if the issue is in your database, a flaky third-party API, or somewhere in your internal service calls.
Now scale that scenario across dozens of services, containers, functions, and cloud providers.
Welcome to debugging in distributed systems. 🎉
This is where distributed tracing becomes not just helpful, but essential.
Tracing is no longer optional
Distributed architectures break traditional debugging. The “grep and hope” model (sifting through logs in multiple tools and correlating manually data) doesn’t scale when your system has no clear center. Worse, without a common trace context, those logs are often disconnected fragments of a bigger, invisible story.
Tracing solves this by linking everything together: every hop, every request, every downstream call is in a single, coherent view.
But effective tracing requires more than sprinkling traceId into logs. It’s about adopting a new mindset, one where you assume your system is always more complex than you think and you design observability into it from the start.
Let’s walk through how to do that well.
What distributed tracing actually gives you
At its core, tracing lets you follow a single request, say, an API call, as it moves through your system. That means:
You see each service it hits, in order.
You see how long each part took.
You see where and why it broke (or got slow).
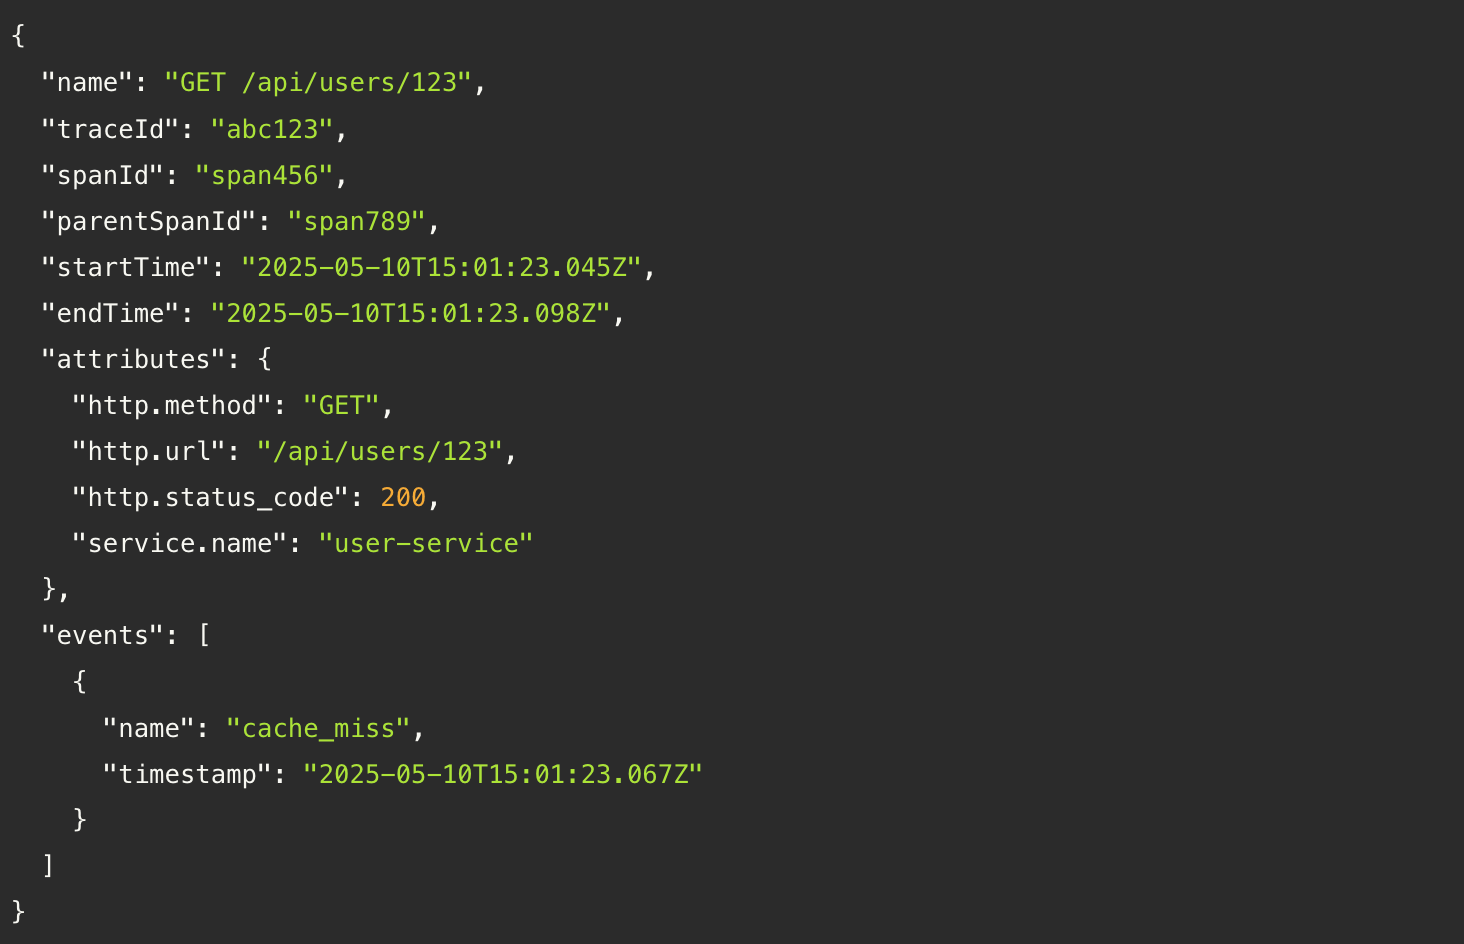
Instead of isolated log lines, you get a trace: a full tree of operations (called spans), complete with metadata, timing, and relationships.
Traces aren’t just diagnostics. They’re architectural X-rays. You can infer system design, service boundaries, dependencies, bottlenecks… all from watching how real traffic flows.
Why logs and metrics aren’t enough
Let’s be clear: you need logs. You need metrics. But you also need to accept their limits:
Metrics tell you something is wrong. e.g., latency is up.
Logs might tell you what went wrong, but only if you find the right service, search the right keyword, and get lucky.
Traces tell you where and why, across service boundaries, with full context.
And critically, traces can connect logs and metrics. A trace ID can join the dots across signals. Without that, your debugging relies on time ranges and assumptions.
Why tracing is hard (and why it’s worth it)
Distributed tracing isn’t free. It asks for:
Consistent instrumentation
Reliable context propagation
Smart sampling
Scalable storage
Integration with logs and metrics
But the payoff is massive:
Faster debugging across services
Fewer “it works on my machine” moments
Visibility into architectural reality (not what’s on the static, outdated diagram no one has updated in the last 6 months)
Context-aware alerting and testing
And with tools like OpenTelemetry, you don’t need to roll your own plumbing. Standardized APIs and auto-instrumentation lower the barrier dramatically.
Best practices (from painful experience)
If you’re getting started, or your tracing data is still a mess, here are a few hard-earned lessons:
1. Start with high-value services
Don’t boil the ocean. Instrument your most critical paths first (e.g. checkout, auth, payments, ingestion pipelines) and expand gradually.
2. Propagate context everywhere
Missing context is the #1 reason traces fall apart. Be meticulous about forwarding traceparent headers or equivalent across every service boundary, especially async flows (queues, background jobs, etc).
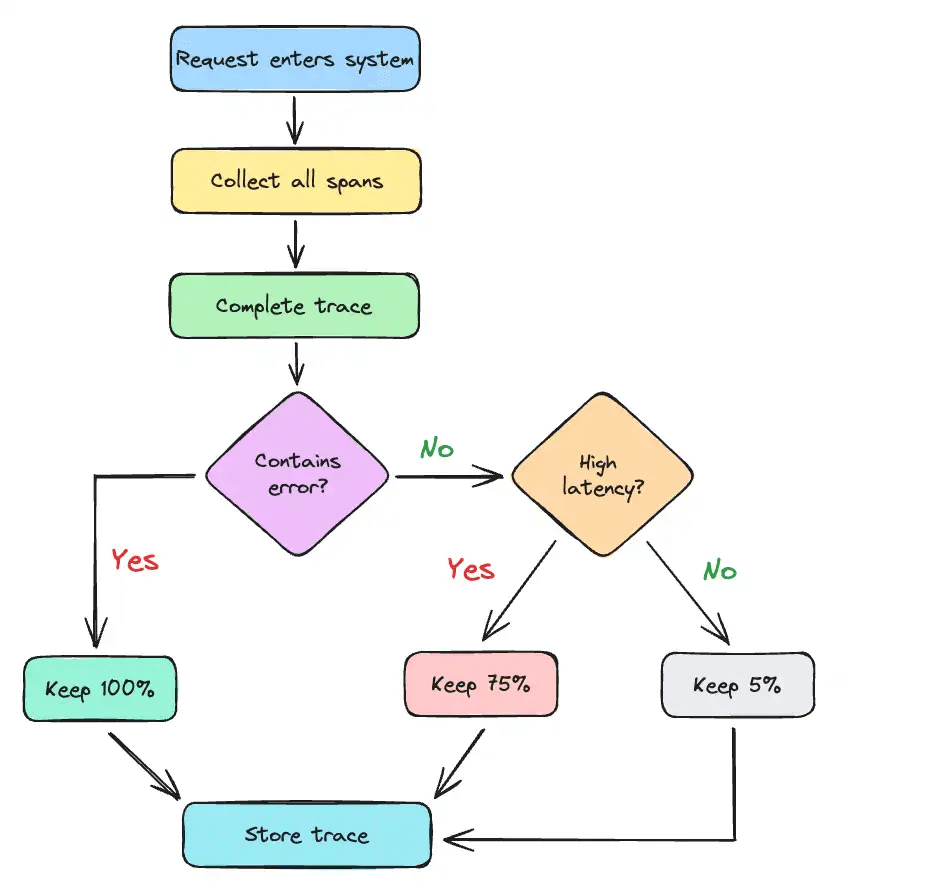
3. Use tail-based sampling where it matters
If you only sample at the beginning of a request (head-based), you might miss the error that happened at the end. Tail-based sampling is heavier, but smarter and increasingly worth the cost on critical paths.
4. Correlate logs with trace IDs
Your logs are 10x more useful when you can pivot from a trace to its corresponding logs. Inject traceId and spanId into every log line and teach your team to search by them.
5. Visualize dependencies
Tracing data reveals what your services actually depend on, not what your documentation claims. Use tools that allow you to automatically discover and document these relationships in real time, letting you spot hidden coupling, unnecessary calls, or outdated assumptions.
Tracing isn’t just for prod
One thing I’m increasingly convinced of: tracing should shift left.
When you trace in dev and staging, you debug faster, design more robust services, and ship fewer surprises. For example Multiplayer uses full-stack debugging replays to auto-generate test script. All the information comes directly from traces, capturing edge cases you didn’t anticipate.
And when a bug does slip through, your traces become your breadcrumbs for preventing it next time.
TL;DR
Distributed tracing isn't a silver bullet, but it's the closest thing we've got to real visibility in modern systems.
If you care about uptime, performance, or your engineers’ sanity, trace early, trace often.
💜 This newsletter is sponsored by Multiplayer.app. AI-powered debugging for distributed systems.
I originally wrote about this topic in this deep dive overview:
Read the original for more information about:
Summary of best practices for effective distributed tracing
Understanding distributed tracing
How distributed tracing works
Implementing distributed tracing
Benefits and challenges of implementing distributed tracing
Best practices for effective distributed tracing
📚 Interesting Articles & Resources
Distributed Transactions Are the Root of All Complexity -
As is Junco’s hallmark, this is another clear and practical guide for engineers navigating multi-service coordination challenges.
The true complexity in modern systems lies not in code or data, but in coordinating actions across independent services. Distributed transactions (i.e. operations spanning multiple services) introduce challenges like consistency, rollback, and network failures. In this article you can find strategies such as orchestrated vs. choreographed Sagas, compensating actions, and patterns like outbox and retries to manage these complexities.
Is Documentation Like Pineapple on Pizza? -
This article is a funny, and painfully relatable take on why documentation feels like pineapple on pizza. Divisive, messy, and often avoided. It captures the emotional weight docs carry for developers: outdated, hard to maintain, and rarely where you need them. While the author stops short of prescribing a silver bullet, I’ll add mine: tools that automatically discover, document and maintain system knowledge like service maps, architecture diagrams, API call flows, and test scripts. Because good documentation shouldn't depend on willpower.
That's How We've Always Done Things Around Here -
Teams often adhere to outdated processes, without questioning why. The article explores why we cling to tradition, how those habits create inefficiencies, and practical ways to challenge and evolve workflows. A compelling read for teams ready to rethink the status quo.