


You can’t improve an API you can’t see
Shorten the feedback loop between cause and effect.

👋 Hi, I’m Thomas. Welcome to a new edition of Beyond Runtime, where I dive into the messy, fascinating world of distributed systems, debugging, AI, and system design. All through the lens of a CTO with 20+ years in the backend trenches.
QUOTE OF THE WEEK:
“What I cannot create, I do not understand” - Richard Feyman
Most engineering teams think they’re monitoring their APIs. They have dashboards, logs, maybe a few alerts. But those tools only tell you part of the story, and often only after something’s already gone wrong.
If you want to truly understand how your APIs are behaving (or misbehaving), you need more than uptime checks and p99 latency graphs. You need a monitoring and observability strategy that reflects reality.
In this article, we’ll go beyond basic metrics and explore how to proactively monitor API performance, detect issues before users feel them, and lay the groundwork for meaningful observability at scale.
Monitoring ≠ Observability
Let’s start with the distinction that, to this day, still causes confusion: monitoring answers “is it working?”. Observability answers “why is it not working?”.
You need both. Monitoring tells you that latency has spiked. Observability helps you trace it back to a downstream service that’s getting throttled in a specific AZ due to noisy neighbors.
If you’re working in a distributed system (and you probably are, as most of us…) you can’t rely on any single dashboard. Requests span services. Ownership is fragmented. Failure is rarely local. That’s why observability matters.
The goal is to shorten the feedback loop between cause and effect.
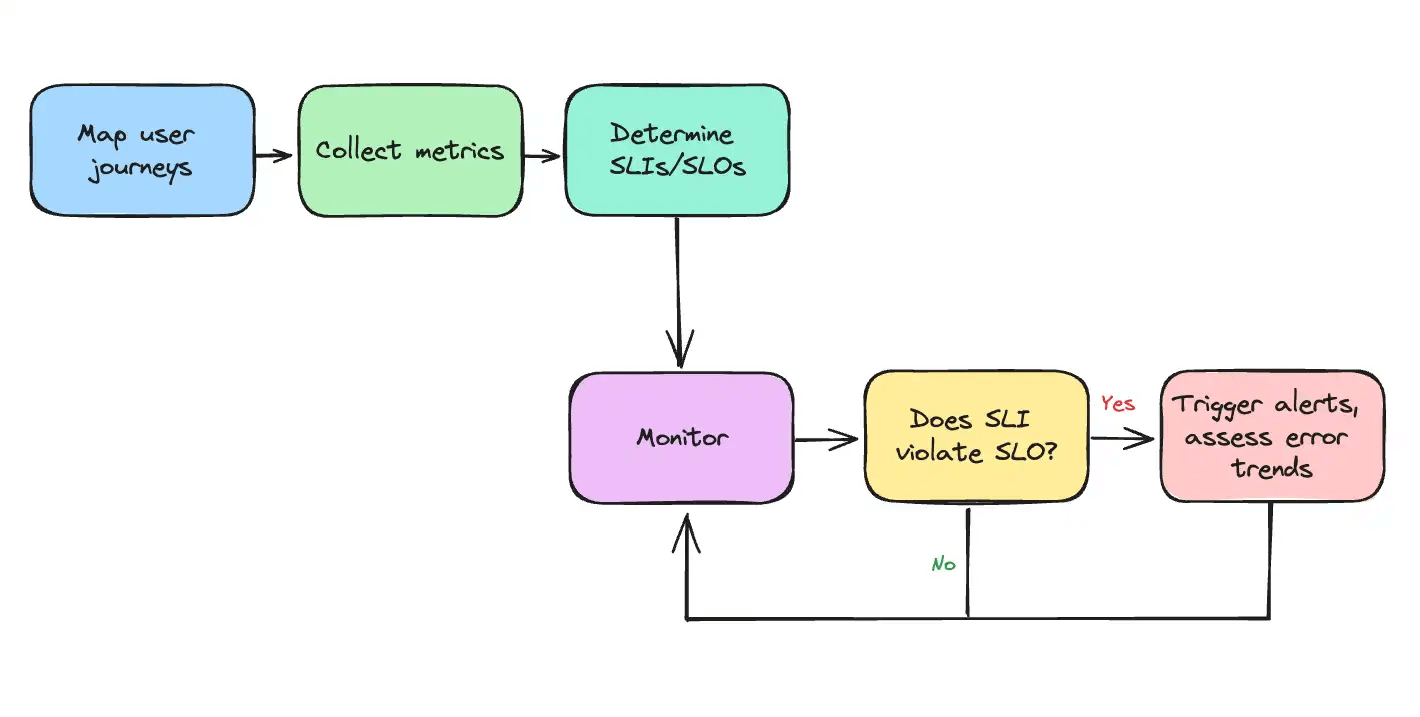
What are you monitoring for?
The first mistake most teams make is treating all metrics equally. Not every piece of telemetry matters. Focus on what directly impacts the user.
That’s where SLIs (Service Level Indicators) and SLOs (Service Level Objectives) come in. Your SLI might be something like:
99.9% of
/checkoutrequests return 200 within 300ms.
Not "CPU < 80%" or "we have Grafana." You’re measuring what the user experiences, not what’s easy to graph.
A good SLO reflects reality. Before you promise 99.99%, baseline your system. Run load tests, understand p50, p95, and p99 behavior, and factor in failure domains like DNS resolution or third-party APIs. Reliability isn’t free; it costs engineering time and burn budget. Be deliberate.
A surprising number of teams set alerts without ever asking: “What’s normal?”
This leads to pager fatigue, alert noise, and desensitization. Instead, treat performance baselines as a form of institutional memory. Use rolling averages and distribution metrics to define thresholds organically.
Want to go further? Don’t just stress-test your infrastructure. Burst test your APIs. Chaos test your dependencies. And measure your system’s behavior across versions, deployments, and environments. That’s how you find regressions before users do.
RED and USE
Once you’ve defined your SLIs, there are two frameworks I rely on:
RED: Rate, Errors, Duration. These focus on user-facing performance.
USE: Utilization, Saturation, Errors. These focus on system health.
You track both because they answer different questions.
If RED is bad (e.g., high error rate), the user is hurting. If USE is bad (e.g., 95% CPU), your infrastructure is trying to tell you something. The correlation between the two gives you the signal.
Add security and data quality KPIs, and you’ve got a pretty complete view of how your APIs are behaving under real conditions. Want to know if your /login endpoint is under attack? Look at 401/403 patterns. Want to know if your contracts are breaking? Track schema violations and % null fields.
The problem with averages (and the power of outliers)
Teams love p95. It’s neat and simple. But problems often live in the long tail.
If your p99 is 4x slower than your p50, there’s probably a dependency dragging things down, but it’s hidden behind the illusion of “average” behavior. That’s why tracking distribution matters. You want to know when even one shard is misbehaving.
In modern distributed systems, anomalies start as whispers: edge-case failures, latency spikes under specific input, cascading retries triggered by a bad config. If you don’t instrument for outliers, you’ll miss them until they snowball.
Structured logging is underrated
Monitoring tells you what. Logs tell you why.
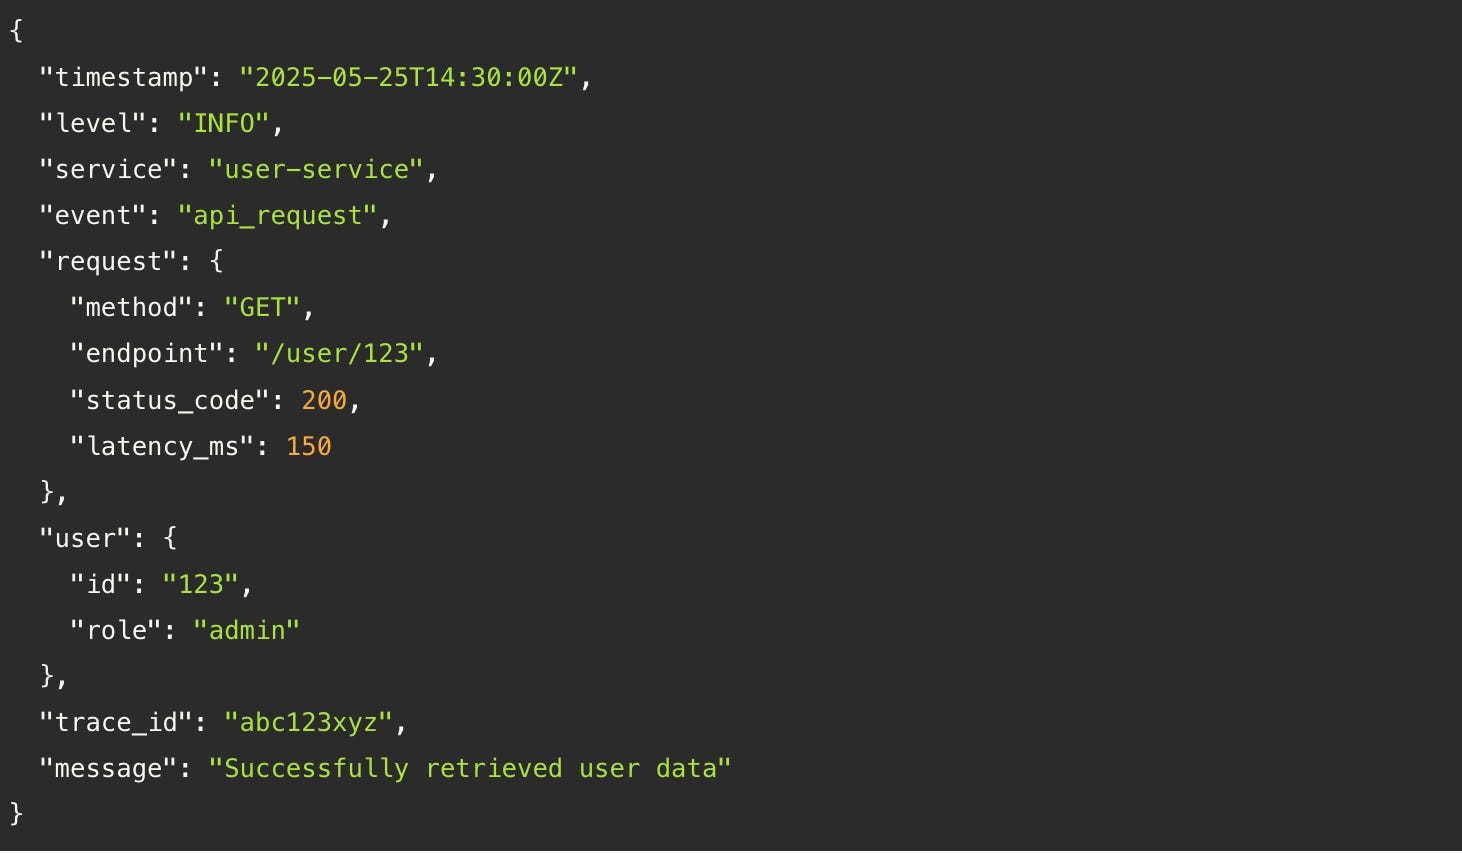
But only if you log like you mean it. That means consistent structure (JSON or protobuf), meaningful context (user ID, request ID, trace ID), and enough granularity to reconstruct intent.
Here’s what a good log entry looks like:
Final Thoughts
Great API monitoring it’s knowing that when something breaks, you’ll know where, why, and how to fix it. Before your users notice. It’s about removing guesswork and building feedback loops that make your system better over time.
Most importantly, it’s about freeing your team from firefighting mode so they can get back to building.
💜 This newsletter is sponsored by Multiplayer.app. AI-powered debugging for distributed systems.
I originally wrote about this topic in this deep dive overview:
Read the original for more information about:
Summary of API monitoring best practices
Implement proactive monitoring
Define key performance metrics
Define SLIs and SLOs
Establish performance baselines
Track outliers and anomalies
Set up observability
📚 Interesting Articles & Resources
How I Accidentally Triggered A Hacker News Manhunt - Anonymous
A modern-day internet thriller: the author posts on Hacker News about a Reddit bot he uncovered, skyrockets to the front page and suddenly the community declares him a bot too. He faces digs into his domain, identity, and posting timelines. A fun, lighthearted, “could-have-happened-to-anyone”, start to your day. 😅
The Prompt Engineering Playbook for Programmers -
This article distills Addy Osmani’s Prompt Engineering Playbook for programmers to help developers get reliable AI-generated code and bug fixes. It’s a great collection of tips from in-context learning, to chain-of-thought, structured output, role prompting, and examples.
Although, if I were to add my two cents, IMO, the best way to get actionable bug‑fix suggestions from AI is to share a full‑stack session recording, which captures correlated frontend and backend data: frontend steps, HTTP calls, backend traces, request/response data, headers, logs, metrics and service dependencies. When an AI tool has that runtime context, it can deliver far more accurate and helpful guidance.
How Much Should I Be Spending On Observability? -
Charity Majors gifts us with a shiny new stat that’ll inevitably show up in every observability startup pitch, podcast, news article… for (at least) the next year: observability budgets typically land around 15–25% of your infra bill (with the understanding that percentage doesn’t scale linearly as infra costs go up).
Jokes aside, I’m a big fan, and this piece is more than just a stat drop. It breaks down the real cost of observability across headcount, tooling, and engineering time, and digs into why it's less about absolute spend and more about ROI: how fast can you detect, understand, and fix issues?
A must-read if you’re trying to justify (or challenge) your team’s observability investment.