
The metrics your manager is watching while you ship PRs
AI coding tools are moving deployment frequency in the right direction. But many other metrics are moving in the wrong direction.

👋 Hi, I’m Thomas. Welcome to a new edition of Beyond Runtime, where I dive into the messy, fascinating world of distributed systems, debugging, AI, and system design. All through the lens of a CTO with 20+ years in the backend trenches.
QUOTE OF THE WEEK:
“For every code change merged, the probability of a production incident has more than tripled.” - Faros Research
If you’re using AI coding tools, your output numbers look good right now. PRs merged, tasks closed, features shipped … all up. At the individual level, the productivity gain is real and it’s visible. But your manager is likely watching a different set of numbers.
I recently came across the the Faros AI Engineering Report 2026: two years of telemetry across 22,000 developers and 4,000 teams.
Here’s what stood out to me: teams are shipping more than at any prior point in the dataset.
Epics completed per developer are up 66%.
Task throughput per developer is up 33.7%.
PR merge rate per developer is up 16.2%.
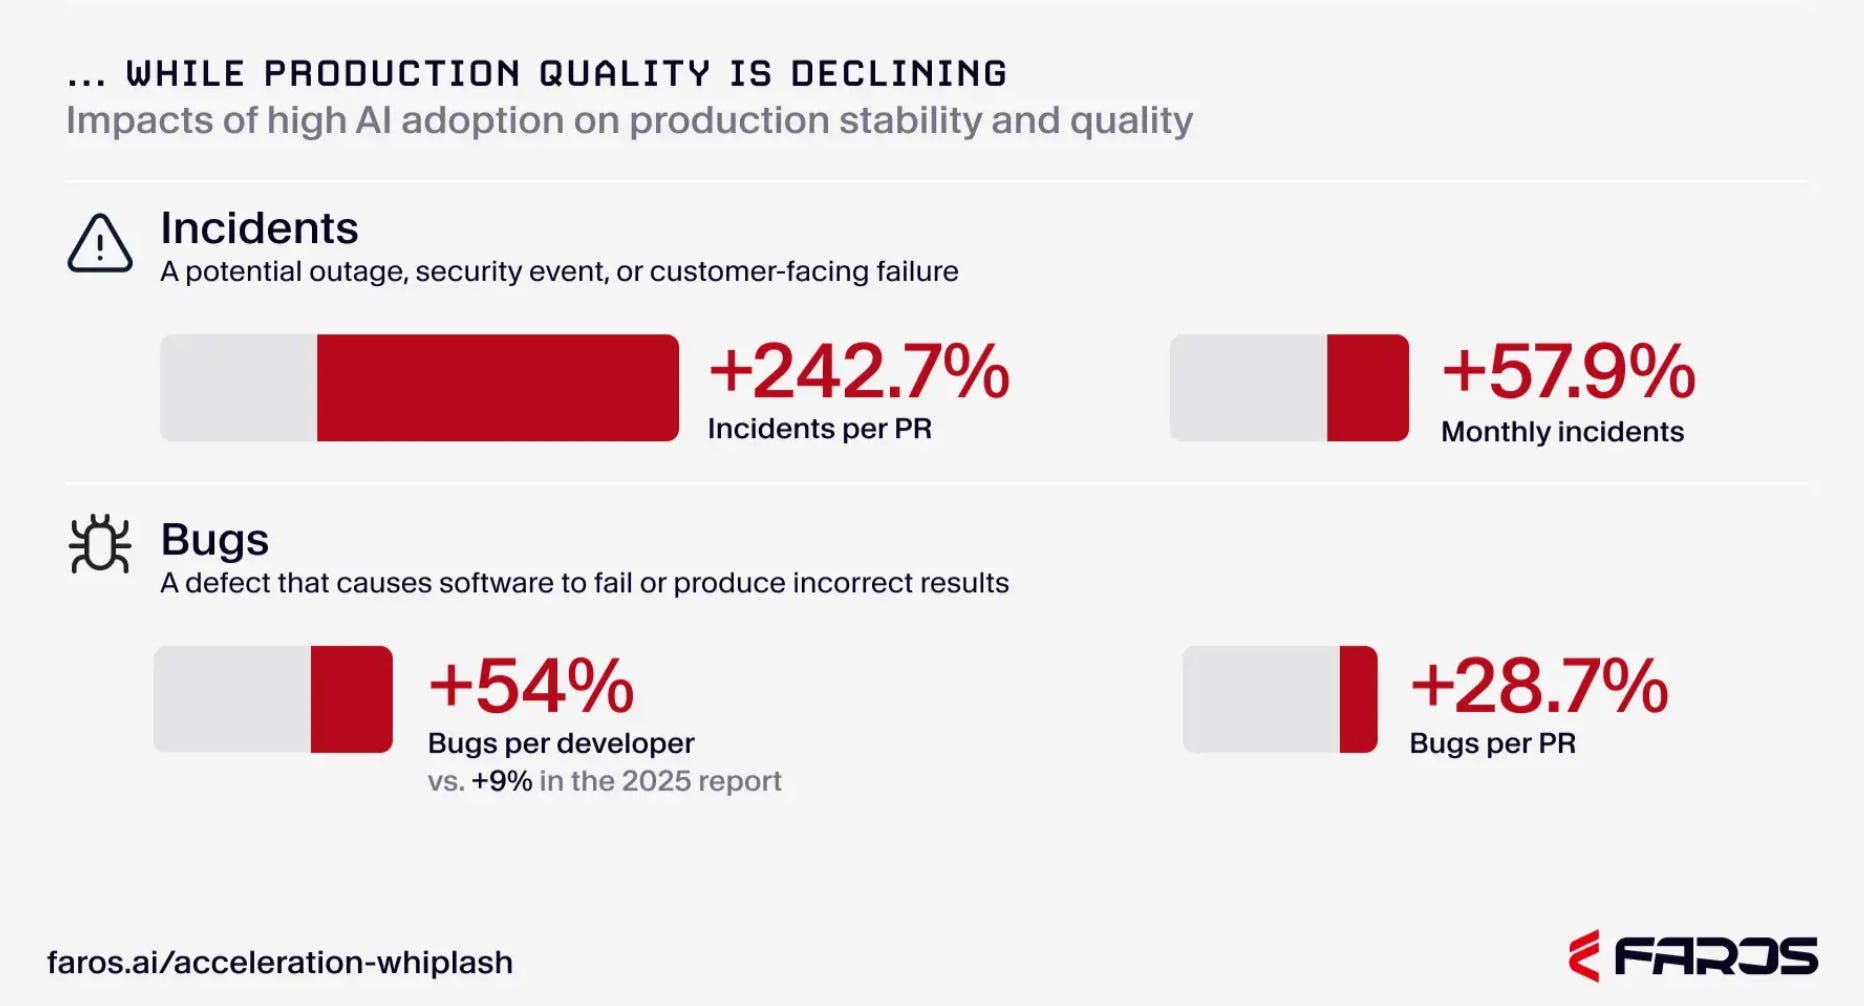
BUT every one of those numbers comes with an asterisk: production quality is declining. ↓ The same report that shows record throughput also shows what's accumulating downstream.
The numbers your manager is watching
Given the side effects of working with AI tools, your manager likely doesn't care how many PRs you opened this week. But they do care about these three metrics:
Change Failure Rate (CFR) measures the percentage of deployments that break something in production. The industry benchmark sits at 4%. Some teams under high AI adoption are now running at 6% and above (i.e. shipping 50% more defects than before). The Faros report highlights that incidents per PR are up 242.7% and monthly incidents are up 57.9%.
Mean Time to Resolution (MTTR) measures how long it takes to recover when something breaks. It stays flat, or moves in the wrong direction, when your team is spending more time untangling AI-generated code that passed every review and still failed in production. Harder-to-diagnose bugs mean longer recovery times.
Deployment Frequency is the number that looks best and means least in isolation. High deployment frequency with climbing CFR is a faster way to accumulate production debt. The two numbers belong together, even thought most dashboards don’t display them side by side.
The senior engineer tax
The CFR and MTTR numbers show up in management dashboards. What doesn’t show up (at least not immediately) is where the quality gap is actually being absorbed.
There is a direct line between the review burden data (PRs merged without any review are up 31.3%) and the production incident data (monthly incidents are up 57.9%). Reviewers cannot keep pace with the volume of AI-generated code arriving for their attention. The queue backs up. Pressure mounts to ship. Code reaches production with no oversight.
And because AI-generated code is superficially convincing, the burden falls hardest on the people least able to spare the time. A junior developer reviewing AI-generated code often doesn’t have enough context to know when something that looks right is actually wrong. Only someone deeply familiar with the system can spot the bugs in the logic, the architecture, the assumptions the agent made about how the system works. That is slow, expensive cognitive work — and it falls disproportionately on the engineers with the deepest knowledge of the system, the same people whose time is most valuable and least available.
This is also visibile in the Faros data:
Median time to first PR review is up 156.6%.
Average time spent in code review is up 199.6%.
Median time in review is up 441.5%
The productivity gain AI delivers at the individual level is being partially paid back here, in review queues, by the people who can least afford to spend time in them.
Final thoughts
The throughput gain is real and visible at the top of the funnel. But the cost is real and steepening: bugs per developer were up 9% in the 2025 Faros report, but in 2026, that figure is 54%.
For most teams relying on AI tools, the productivity bottleneck has moved: from writing code to verifying it. Those who understand that this is a data problem (not a discipline problem as I’ve seen mentioned) have already started addressing the underlying causes and evolving their approach to better fit these new workflows.
The teams still optimizing for vanity metrics will get there eventually. The Change Failure Rate numbers will make sure of it.
💜 This newsletter is sponsored by Multiplayer.app, the debugging agent for developers.
📚 Interesting Articles & Resources
The McNamara Fallacy - Jono Hey
The McNamara Fallacy is a belief in easy-to-measure quantitative metrics at the expense of ignoring hard-to-measure qualitative factors. PRs merged, tasks closed, features shipped: these are McNamara metrics. They're real, they're visible, and they're not the whole picture (even though, in this case, we also have plenty other negative qualitative factors 😅).
Observability tools weren’t built for AI debugging - Thomas Johnson (me!)
AI agents are only as good as the data they can access. And yet, we’re collecting too much irrelevant (and costly) telemetry data, and we’re missing critical debugging data due to instrumentation costs and siloed tooling.